Brillion
From pilots to patterns—Brillion makes energy impact visible


Some campaigns light up the board; others barely flicker. Utilities knew they were asking customers to save energy—but not which messages actually moved the needle. We helped Brillion.ai turn hunches into a product: a software-as-a-service (SaaS) platform that shows which outreach works, for whom, and by how much.
THE CHALLENGE
Create an analytics product for utilities to measure the effectiveness of energy-reduction campaigns. Keep complex data legible, actionable, and aligned with stakeholder expectations and industry norms. Do it in four months, prioritize clarity over bells and whistles, and set up a foundation the dev team can build on without surprises.
What we made (and why)
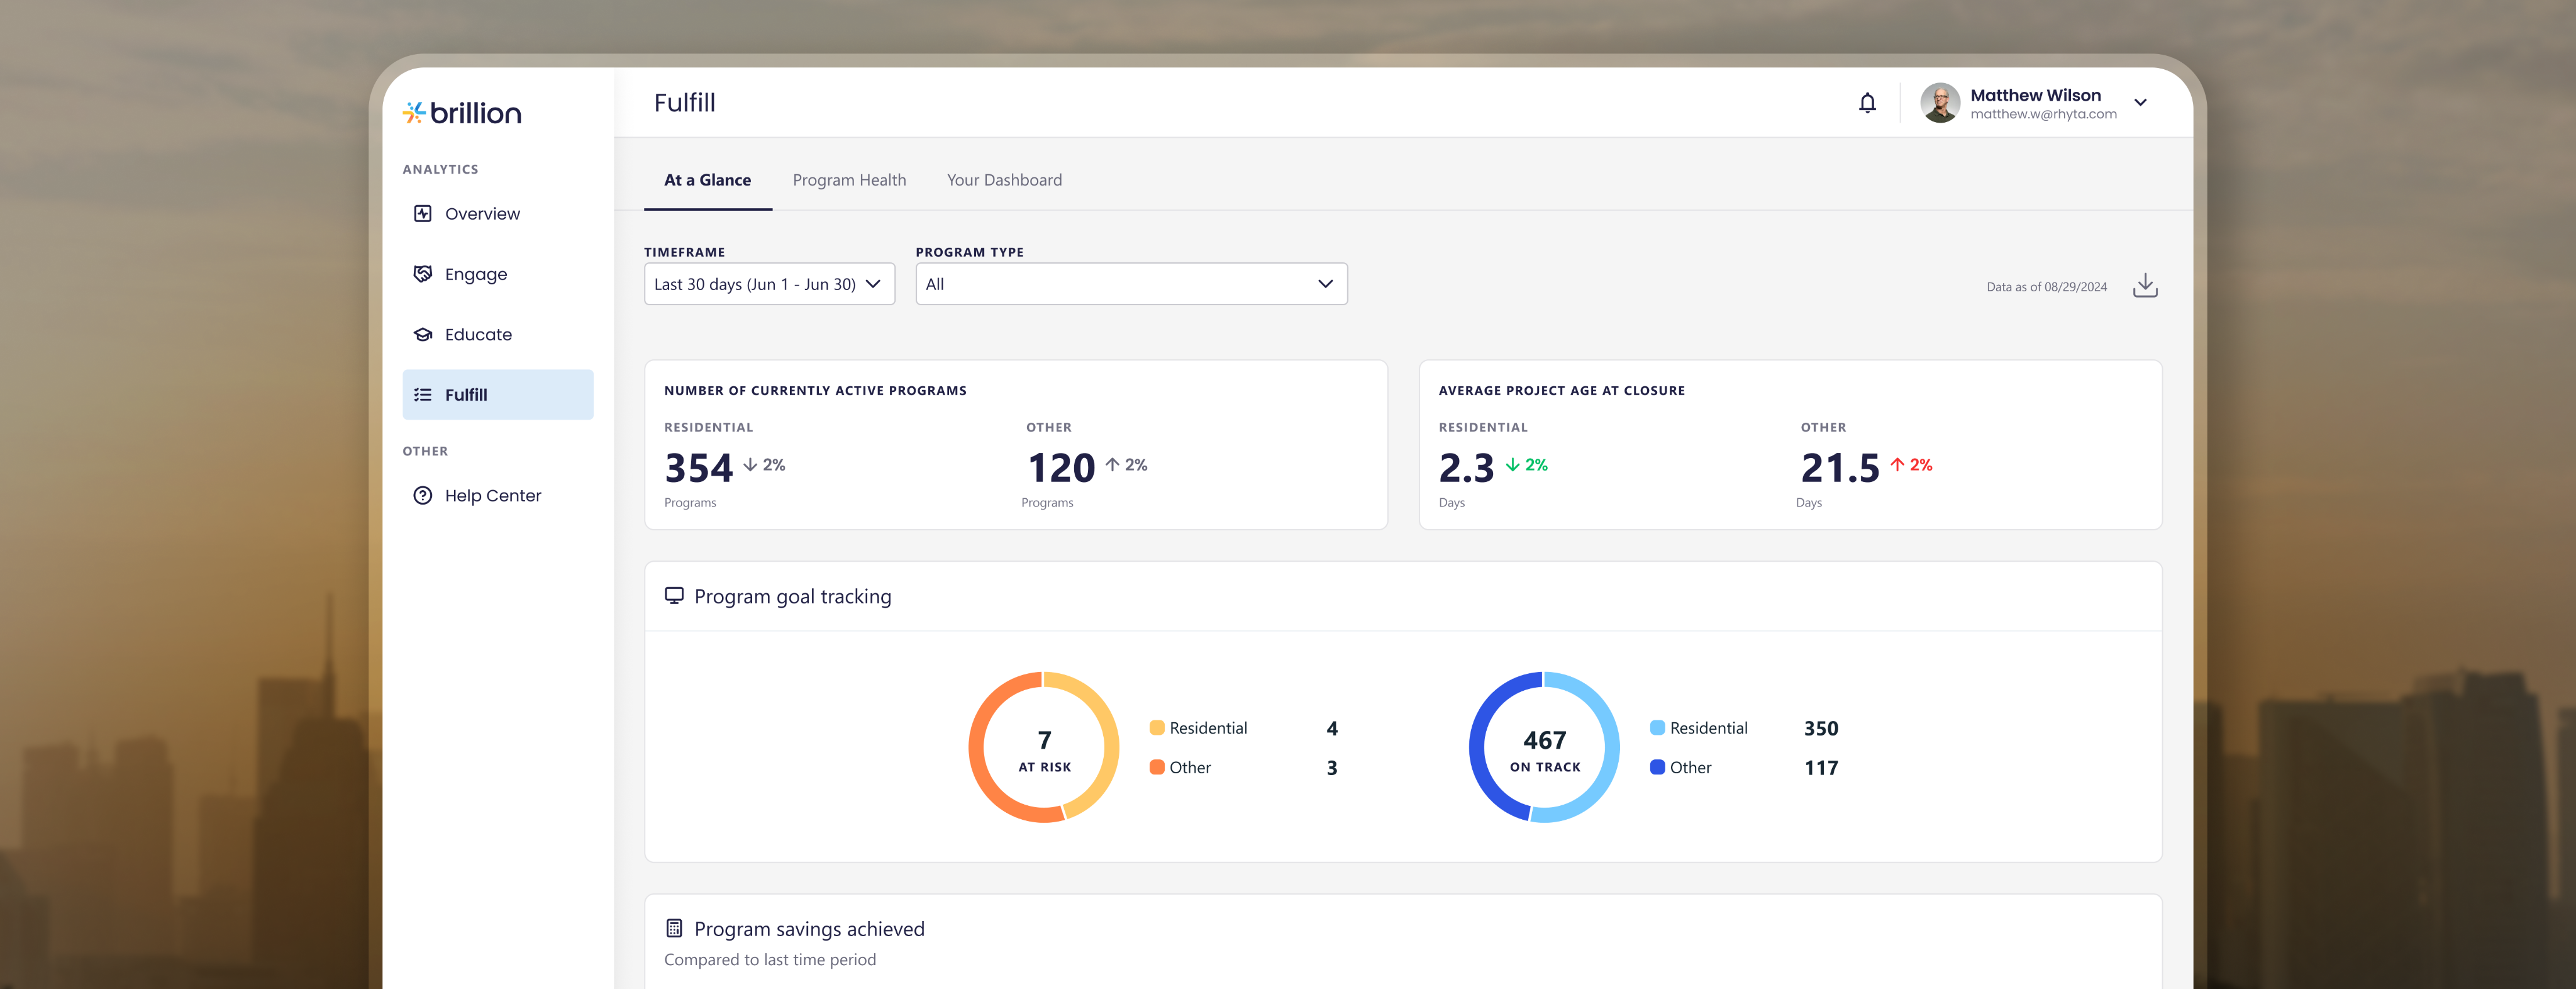
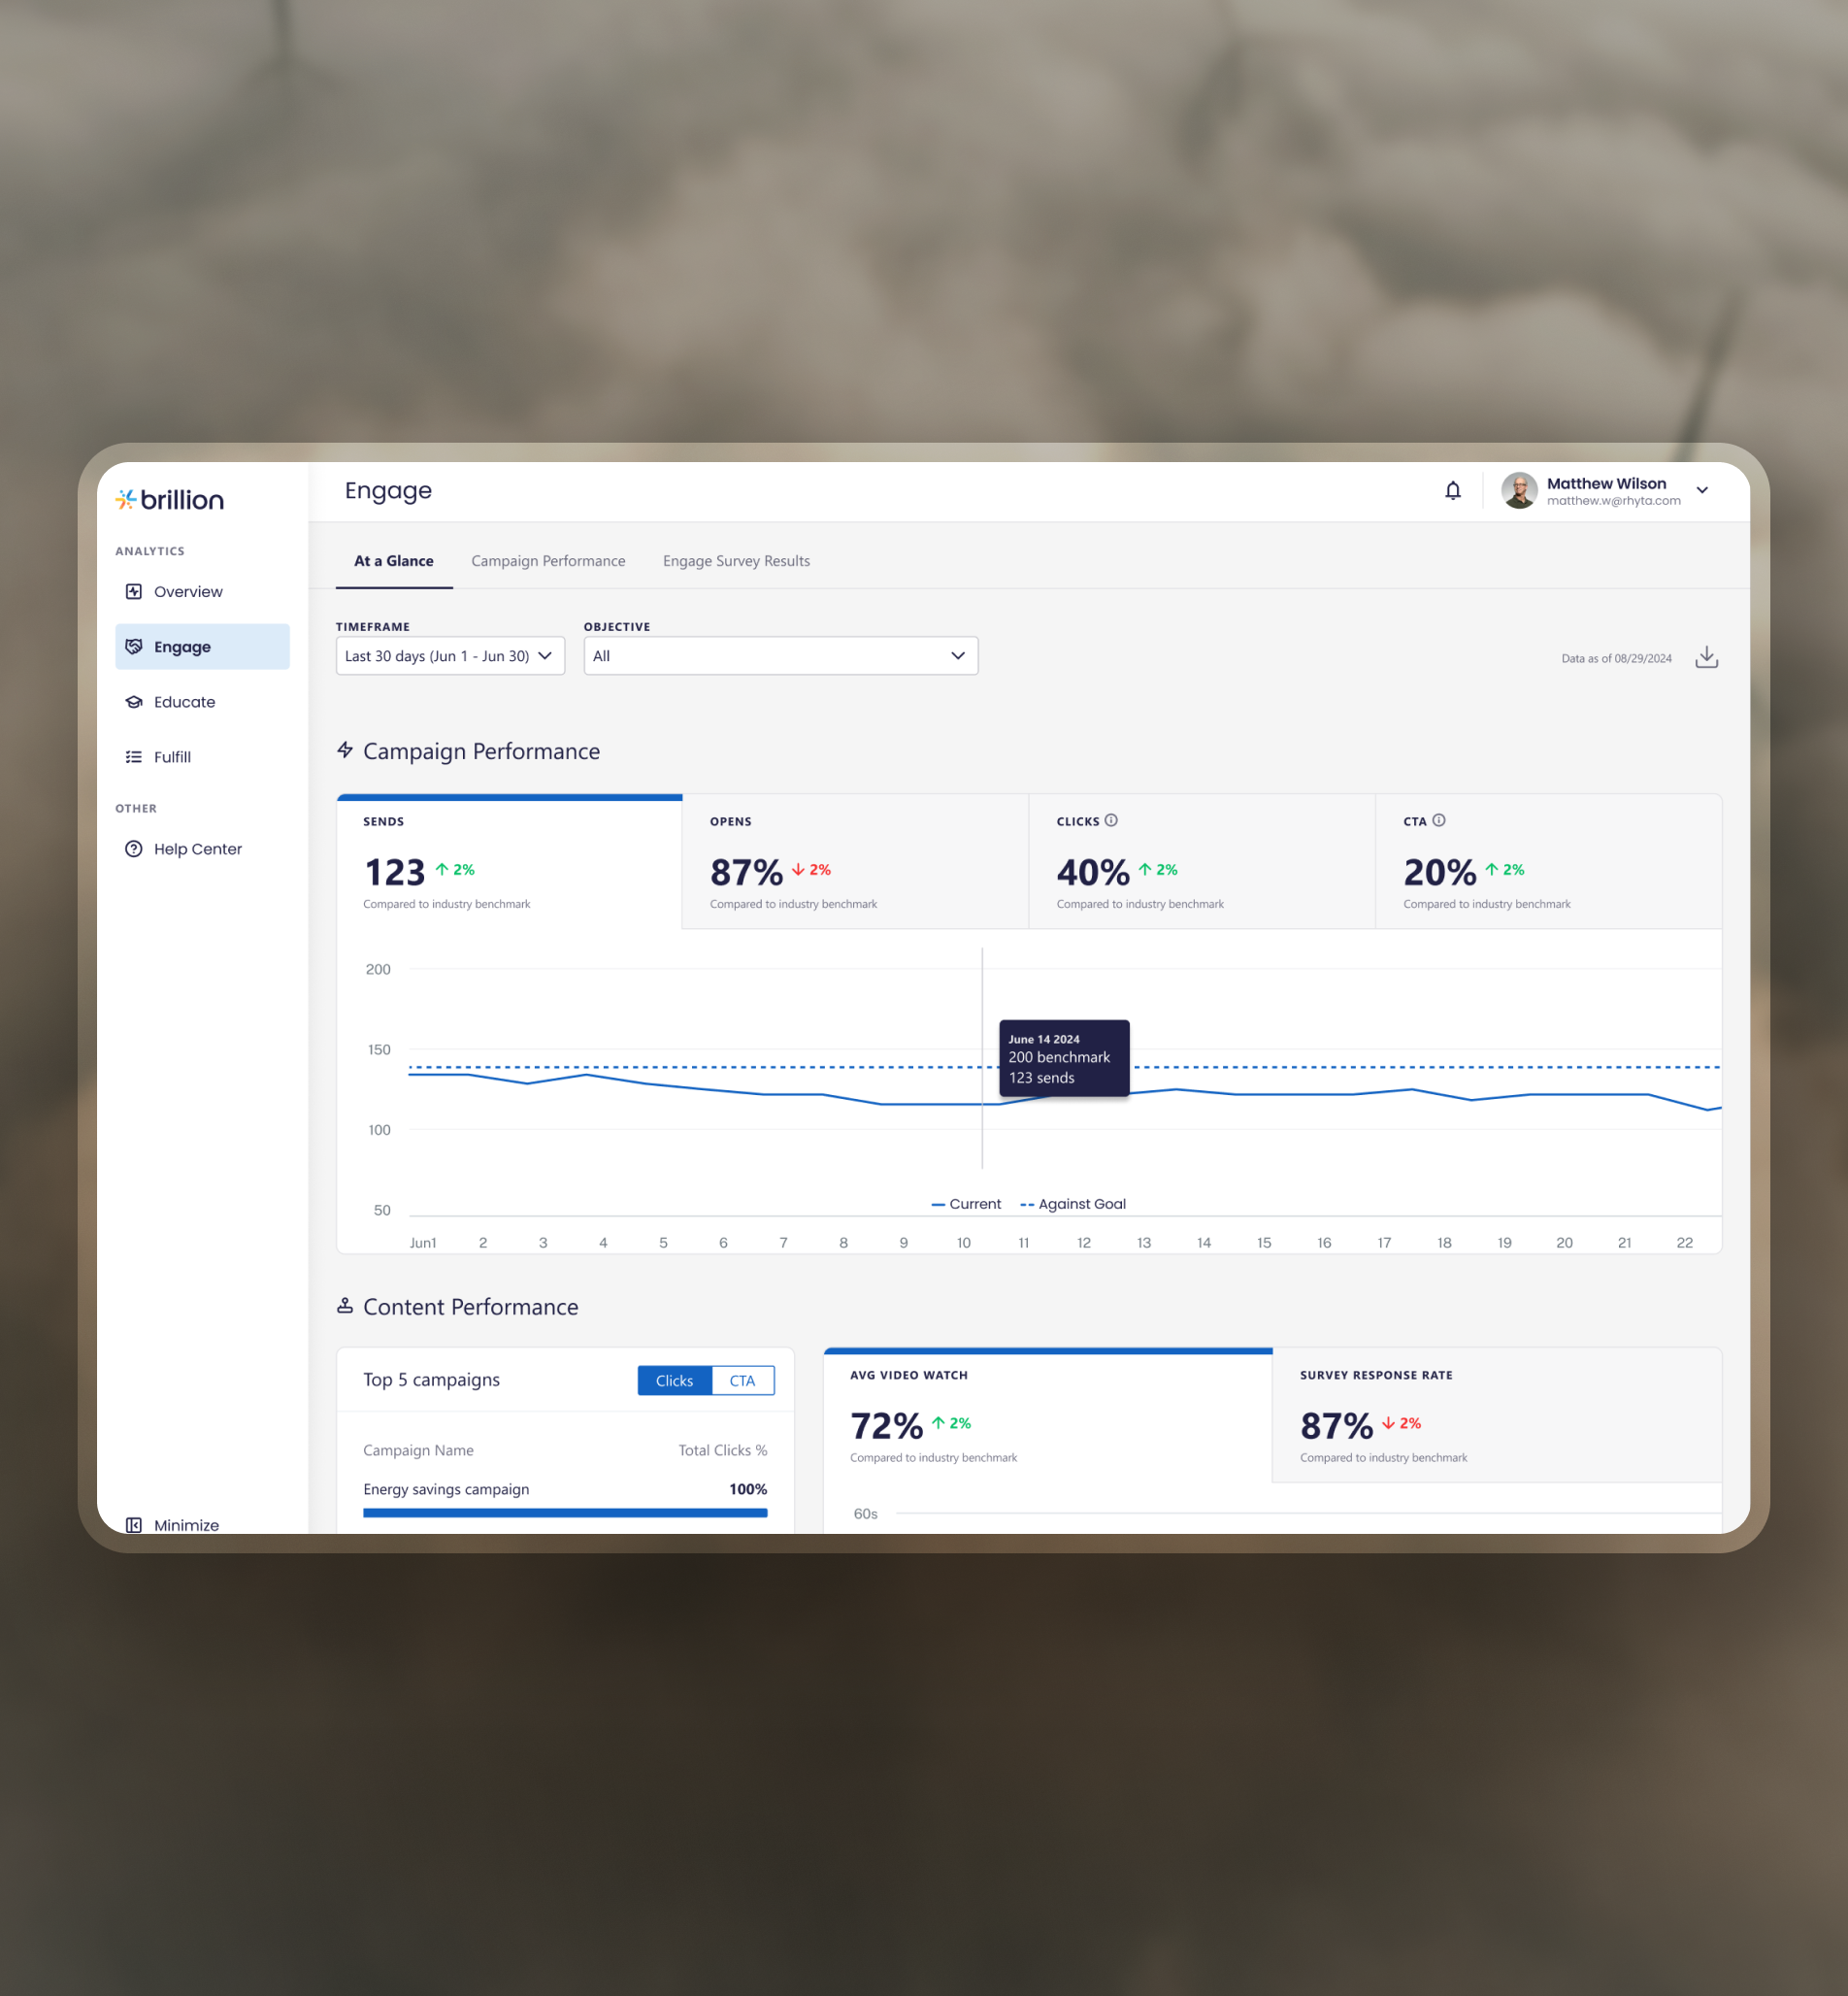
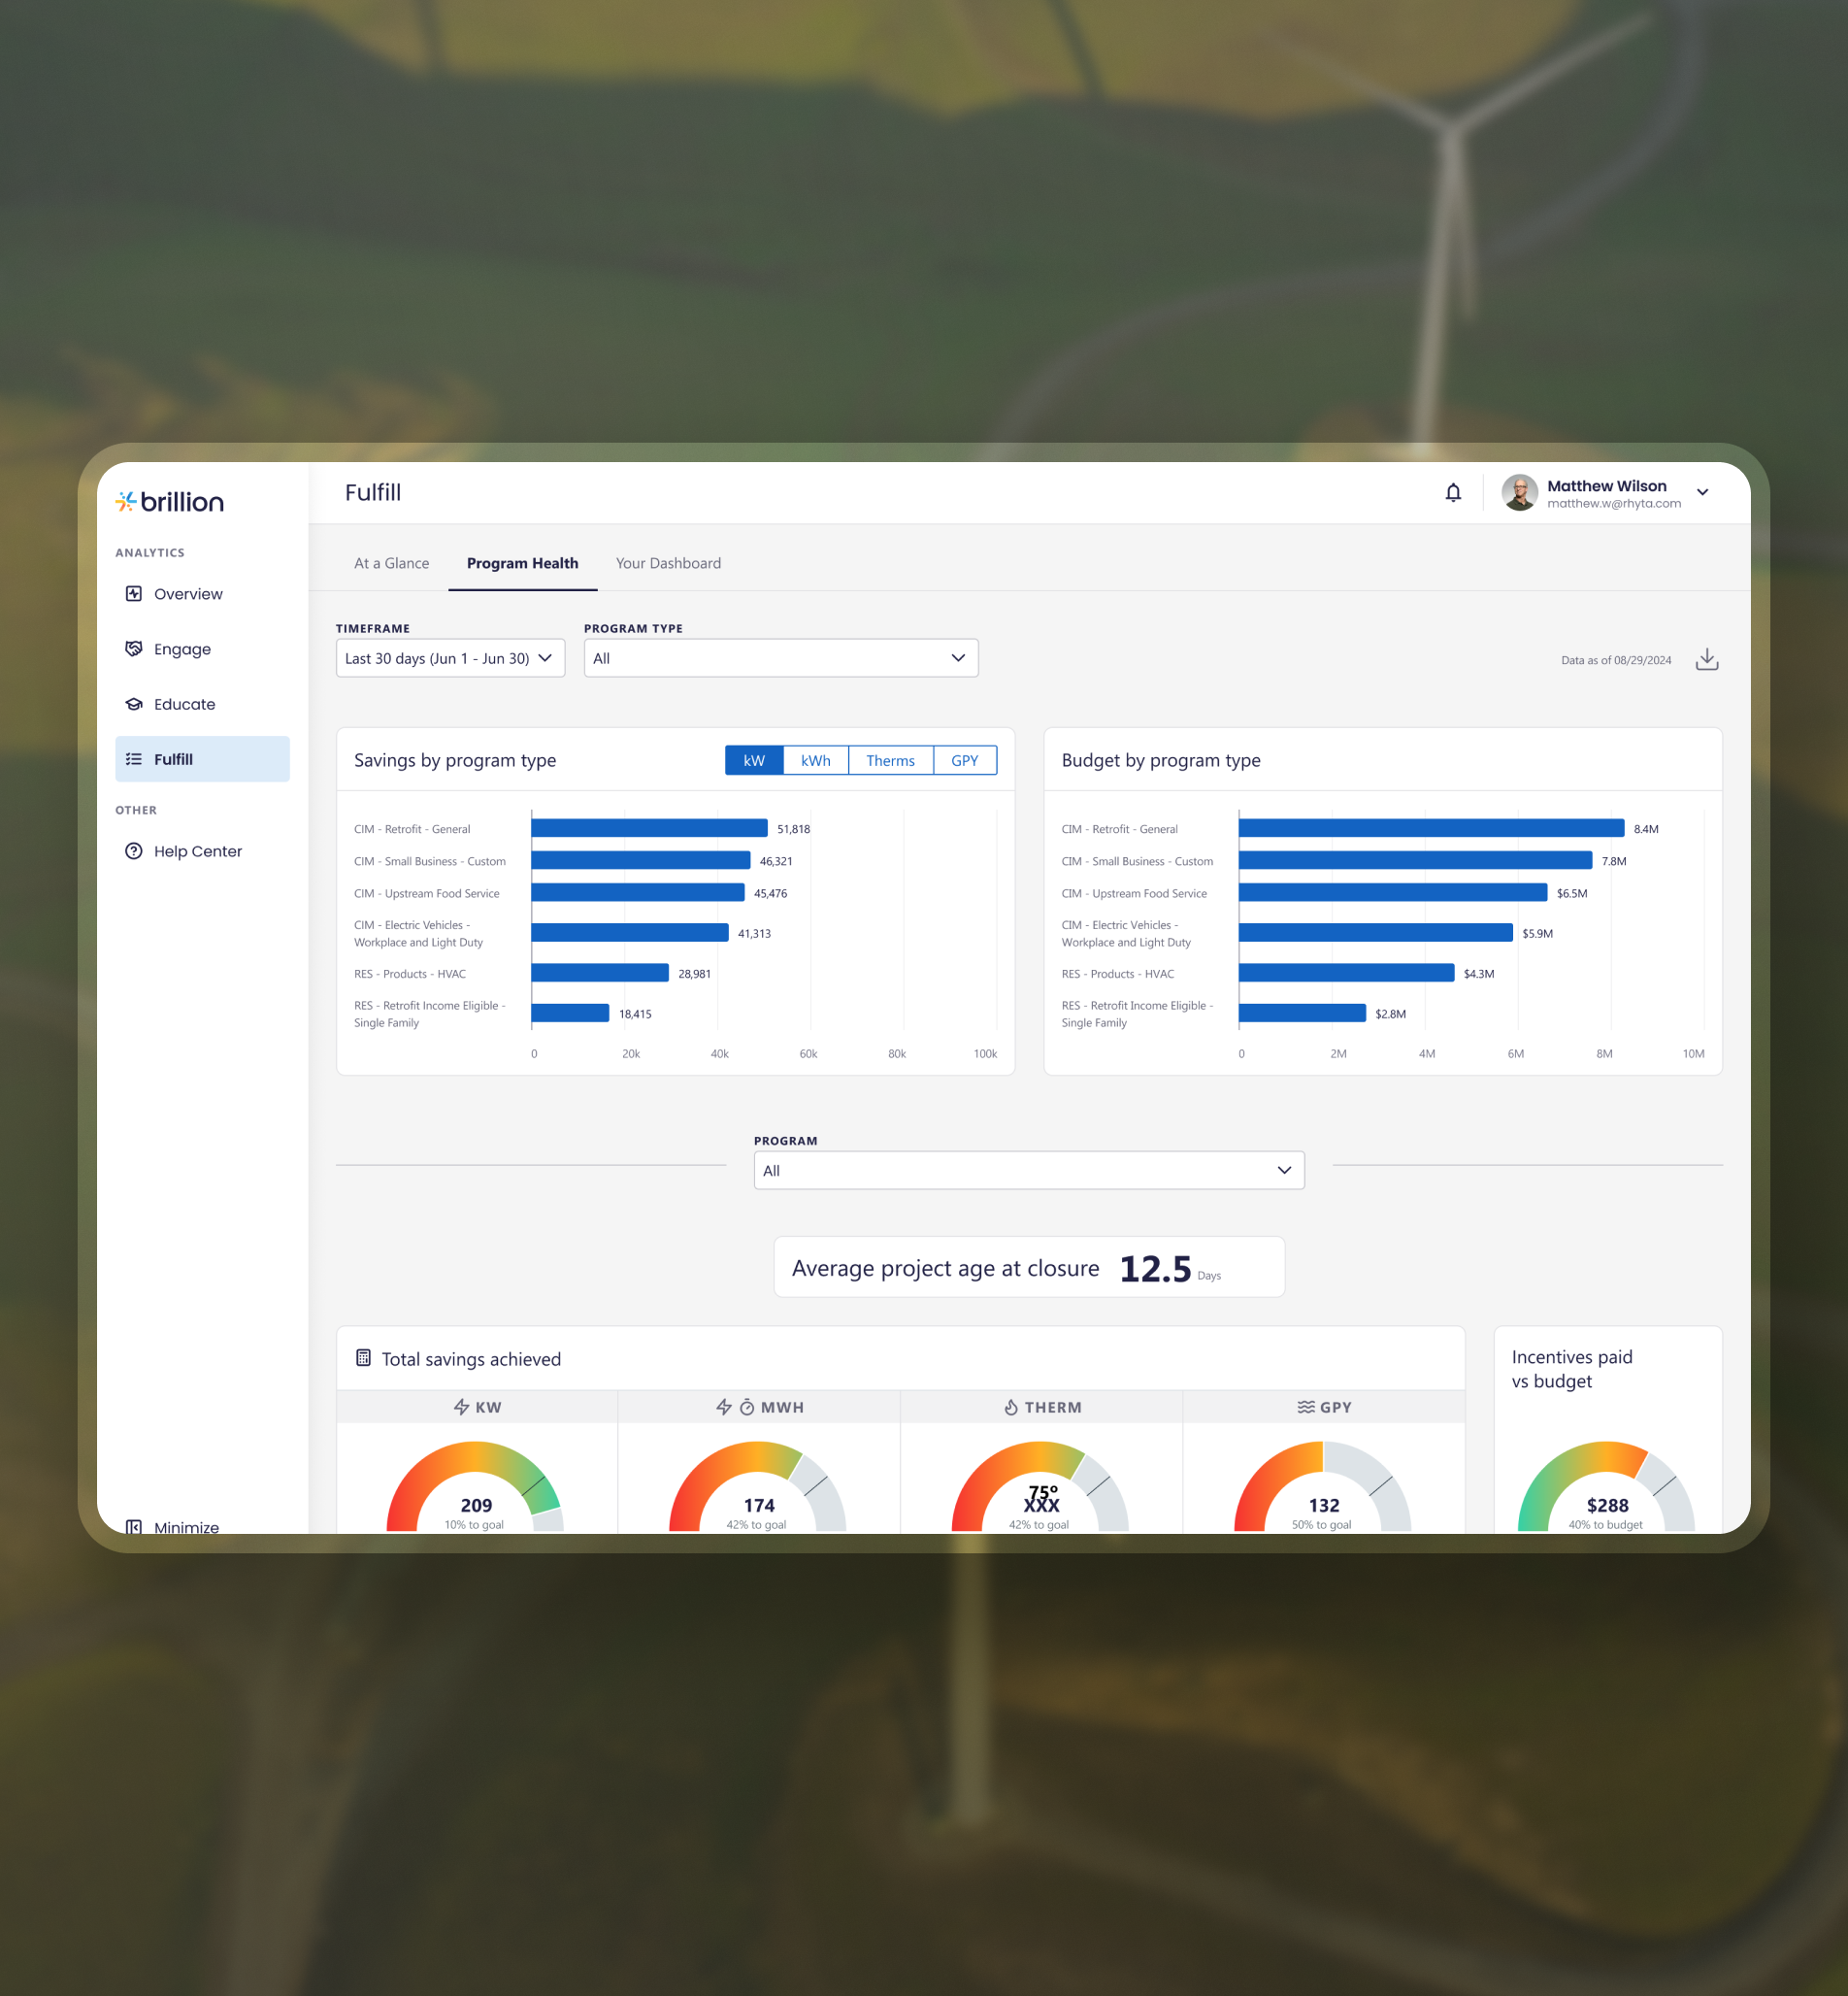
A coherent design system and product blueprint: IA, sitemap, low-fi wireframes to test flows, then high-fi UI that keeps decisions simple. Dashboards highlight “what changed” with clear comparisons; detail views let analysts slice by audience, channel, and campaign. Empty states, loading, and errors are written like a good teammate—helpful, not cryptic.
Small kindnesses add up: labels that match how people talk, units always visible, and no surprises when exporting or sharing.
Results (and what’s next)
Brillion.ai left discovery with a shared product vision, developer-ready files, and specs that eliminated back-and-forth on intent. Stakeholders aligned on the questions the platform answers and the metrics that matter—so build can move with confidence.
Next step: plug in real program data, validate dashboards in pilot utility accounts, and expand comparisons (by audience, season, and channel) without bending the core IA.
How we kept it human—and fast
Start with the people. We co-created user types (program manager, analyst, executive) and wrote their top questions in plain English—so screens answered those questions first.
Design for first-glance and deep-dive. Cards and compact charts for the headline; simple paths for breakdowns by audience, channel, and time.
Opinionated defaults. Pre-filled vendors, common categories, and price ranges → fewer abandoned entries and more consistent data across users.
Name tradeoffs in daylight. Fewer chart types, consistent patterns—speed of understanding beat novelty.